
Kilpling Global Enhanced Growth Fund Q1 2026
- John Poulter

- Apr 17
- 7 min read

Investors do not like economic uncertainty, geopolitical turmoil and erratic behavior by important people making questionable decisions. The returns posted during the latter half of the 1st quarter demonstrated the aversion to uncertainty once again.
Globally, equity markets started 2026 with promising returns. The MSCI World Index enjoyed a reasonable 5% gain as we were closing in on the end of February. We were confident that high-quality companies with great growth characteristics would start to perform in line with their long-term potential. Unfortunately, the beginning of hostilities in the Middle East erased those returns, and in turn pushed out our expectations for markets to normalise. As we moved through March, markets dipped over 9% and reached lows with only two days before the end of the quarter.
As we move into the 2nd quarter, it seems that the only thing we can depend on is disturbing volatility. Volatile swings are randomly buffeting investments as a result of conflicting geopolitical information pouring from social media. Iranian memes and Trump bombast are at all-time highs. Energy prices are spiking higher; market pundits are pontificating on credit market health and overblown inflation fears are circulating in the press. While none of this is comfortable, we are inclined to look through the hubris and focus on an economic landscape that appears quite solid even if growth is slowing. Furthermore, it is likely that private credit market concerns are specific and concentrated, meaning they are not systemic.
The war in the Middle East is becoming increasingly politically uncomfortable in the USA meaning it will likely (and hopefully) be a short-term event. Inflation caused by higher oil prices will be recognised as something higher Federal Reserve rates cannot fix and oil prices will decline when the USA ends the hostilities. Economic growth will likely slow somewhat but we won’t see a recession. We fully believe that high growth and high-quality companies will be rewarded in the coming months with a significant bounce, but it's likely we will have to endure more uncertainty before we get there. Importantly, investors should not panic. Our prescription is to focus on the best companies with the highest growth rates and take advantage when the best companies see lower prices.
Global equity markets delivered strong returns over 2025: At year end, the MSCI ACWI Index was higher by almost 22% in USD, despite bouts of volatility, economic and political uncertainty and with only modest help from the high-quality constituents of this index.
As macroeconomic and interest rate uncertainty returns to shape the market environment, investors are reassessing which areas might best sustain earnings in a slower-growth environment. MSCI’s Quality Indices are constructed by selecting companies based on profitability, balance-sheet strength and earnings stability. These companies have historically outperformed the broader indices during periods of higher volatility, falling growth and an accommodating fed.
High profitability, stable earnings and sequential growth are the foundation of our Kipling Enhanced strategies. The long term returns of these factors and characteristics are simply too attractive to ignore. Presented below are recent statistics provided by Morgan Stanley that highlight the dependably superior results of profit-driven quality. There is no arguing that these factors were out of favour with investors and markets last year. While unusual, there were a few legitimate reasons why investors rotated away from high quality and into lower quality companies. Also unusual was the result that this proved to be a better place to invest. We don’t think those relative returns will persist.
Valuations came into question through 2025. Investors took gains in the world’s best companies and rotated to what was deemed to be better value and, in many cases, defensive sectors. As the negative momentum accelerated many higher quality companies saw their lower prices eventually bottom. And I use the word “bottomed” here on purpose. I think the lower performance in High Quality is over.
The valuation criticism was valid. The difference in valuation between high and low growth was at a high peak?. A recent study by Russell noted that high-quality stocks traded at a 57% P/E premium over low-quality ones, a 94th percentile occurrence and the largest gap since 1995.
The value gap created something termed a “quality paradox” where the best companies experienced single digit gains while low quality returns were well over 20%. This differential in returns creates serious headwinds or challenges for Quality arbitrage long/short strategies. Quality arbitrage strategies focus on leveraging to higher quality weights by using inferior companies as the source of additional capital. Fundamentally, we believe that this “paradox” is difficult if not impossible to maintain. High quality and higher growth companies have, for decades, produced dependably higher returns. We expect that high quality outperforming low quality is being setup in markets today. The valuation premium has certainly narrowed. Furthermore, Higher Quality also outperforms in lower growth environments and Higher Quality also does better when rate policies favour rate cuts.
Earnings Growing and P/Es Valuations Compressing
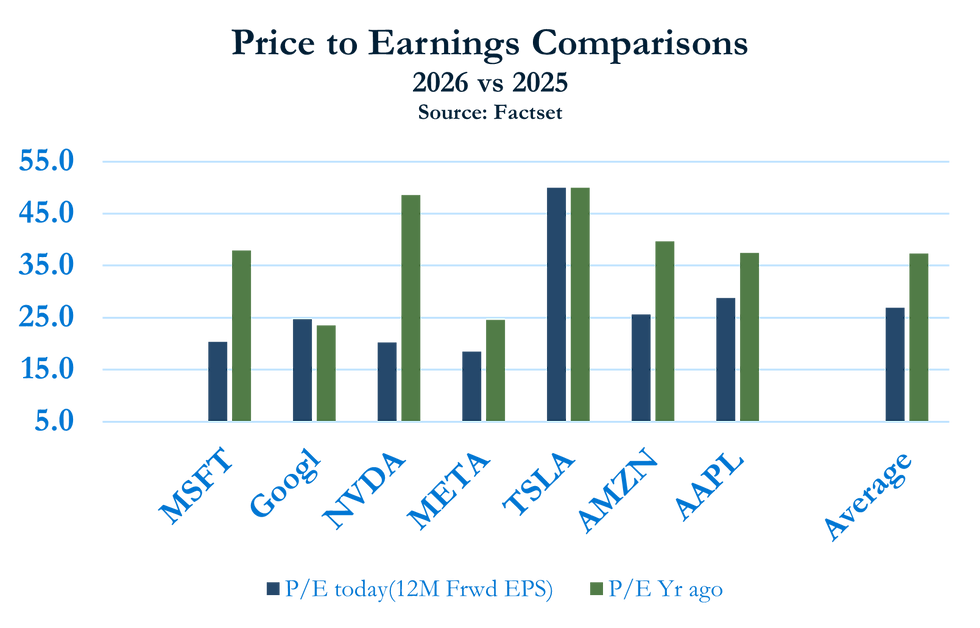
The highest quality companies have struggled with soft market prices, yet their earnings have continued to grow. This combination has created a significant Price to Earnings (P/E) compression. Using the MAG 7 as an example and comparing ratios from the beginning of last year with the multiples today, we can measure this compression and it is notable. The table on the top below shows the P/E differentials. At the beginning of last year, this group of companies had an average P/E of 35X (green bars) whereas today it stands at 24X.

This P/E compression has occurred all the while these companies continue to show higher sequential earnings and other growth statistics that are impressive. The MAG7 is forecasted to produce average return on equity (ROE)s of over 36% next year. Long-term earnings growth is expected to be 15%, a number that is 6% above the market average. We do not invest in growth at any cost, but after the last year, the opportunities to surface value in high quality growth companies have increased significantly. The MAG 7 is only a small sample of 100s of companies spread out through many sector and countries where we look for quality and high growth candidates. Below we will review how our current holdings stack up against the market in terms of Growth and Quality.
In the past year (April 2025 – April 2026), companies defined by high growth, profitability, and quality have underperformed due to a massive "rotation" where investors shifted capital toward cheaper "value" stocks, cyclical sectors like energy, and small-caps. As discussed above, this shift was triggered by extreme valuation gaps.
Dependable Performance
For portfolio managers that focus on investments that are defined by fundamental quality, this environment was extremely frustrating. The investment prescription to focus on the long-term growth in stable earnings is a solid strategy. However, as with any game plan, from time to time there will be breaks from the norm. However, the return statistics below provide a pretty good reason to stay the course and stick with the Quality discipline.

The chart and tables above make the case for an investment strategy based on Quality as the cornerstone characteristic. The returns reported above are the results of a subset of the MSCI’s World index. The subset is selected from the broader index by selecting companies with high return on equity (ROE), stable year-over-year earnings growth and low financial leverage. The MAG 7 are prime examples but many others also fit the bill. As the chart shows the Quality index has provided significantly higher returns. It doesn’t outperform every year but it did 9 times out of the 14 years as shown on the upper table. As the lower table shows, since 1994 ,it has outpaced the parent index by over 3%. The lines on the chart visually tell the story. The chart also shows how unusual the past few months have been. We firmly believe our strategy of building Quality and high growth portfolios will produce returns reflected in the numbers presented above.
Growth and Profitability
Our Kipling portfolios lean heavily on the Characteristics used to create the MSCI All Country World High Quality Index. To create a high quality portfolio, we actually add several factors that help us magnify the key value-added attributes. While we look for significant sequential year-over-year earnings growth, we also include momentum in earning expectations and, in addition to that we include a forecast for earnings growth over the next 3 to 5 years. Return on shareholder equity (ROE) is an important indicator for profitability but it's not the only measure to gauge profitability.
Our models also look at cash flow metrics that measure Return on Invested Capital, and we require our investments to demonstrate sequential growth in cashflow. We also like to see our companies being rewarded in the market for their attractive characteristics. Stock price momentum and other technical measurements also help us determine if we are rewarded and being paid for the Quality we are buying. The Kipling Enhanced equity programs buy high quality companies and short sell lower quality companies. The bar chart below shows a comparison of Return on Equity (ROE) and the last annual growth in Free Cashflow (FCF). Our objective is to benefit from the arbitrage of quality as defined by owning higher growth companies. We own companies that are representative of the constituents in the MSCI World Quality Index. We hope we have harnessed the characteristics that drive the excess returns that this index dependably delivers.

Last year was one of those years where Quality did not keep up. So far this year Quality is being edged out by the broader index but, given all the uncertainty and global chaos, it is difficult to read too much into the first 3 months of the year. It is rare that the Quality characteristics underperform over sequential years. Given the valuation correction discussed above, and coupled with an economic environment that favours growth and profitability, we are optimistic for the returns over the coming quarters.


Comments